 DNA Levels at Different Stages of Clinical Course in Patients with Chronic HBV Infection in an Endemic Area (Jeong Heo & co)")
Source : J Korean Med Sci 2003; 18: 686-90
Written by : Jeong Heo, Tae Hyun Baik, Hyung Hoi Kim*, Gwang Ha Kim, Dae Hwan Kang, Geun Am Song, Mong Cho, Ung Suk Yang (Department of Internal Medicine and Laboratory Medicine*, Pusan National University College of Medicine, Busan, Korea)
Address for correspondence
Mong Cho, M.D.
Department of Medicine, Pusan National University
College of Medicine, 1-10 Ami-dong, Seo-gu, Busan
602-739, Korea
Tel : +82.51-240-7215, Fax : +82.51-244-8180
E-mail : mcho@pusan.ac.kr
![]() The aims of this study were to investigate serum hepatitis B virus (HBV) DNA levels at different clinical stages in patients with chronic HBV infection, and to determine the serum HBV DNA level that discriminated HBeAg-negative chronic hepatitis B (CHB) cases from inactive HBsAg carriers. In all, 222 patients, encompassing 68 HBeAg-positive CHB patients (HBeAg-positive, ALT-elevation), 89 HBeAg-negative CHB patients (HBeAg-negative, ALT-elevation), and 65 inactive HBsAg carriers (HBeAg-negative, ALT-normal), were tested. The ALT levels had been tested more than twice during the previous six months, and the serum HBV DNA levels were quantified by a polymerase chain reaction-based assay. The serum HBV DNA levels of the HBeAg-negative patients were significantly lower than those of the HbeAgpositive patients (median 2.7×10⁴ vs. 1.6×10⁸ copies/mL; p=0.000).
The aims of this study were to investigate serum hepatitis B virus (HBV) DNA levels at different clinical stages in patients with chronic HBV infection, and to determine the serum HBV DNA level that discriminated HBeAg-negative chronic hepatitis B (CHB) cases from inactive HBsAg carriers. In all, 222 patients, encompassing 68 HBeAg-positive CHB patients (HBeAg-positive, ALT-elevation), 89 HBeAg-negative CHB patients (HBeAg-negative, ALT-elevation), and 65 inactive HBsAg carriers (HBeAg-negative, ALT-normal), were tested. The ALT levels had been tested more than twice during the previous six months, and the serum HBV DNA levels were quantified by a polymerase chain reaction-based assay. The serum HBV DNA levels of the HBeAg-negative patients were significantly lower than those of the HbeAgpositive patients (median 2.7×10⁴ vs. 1.6×10⁸ copies/mL; p=0.000).
In addition, the HBV DNA levels of the HBeAg-negative CHB patients were significantly higher than those of the inactive HBsAg carriers (median 2.2×10⁵ vs. 3.2×10³ copies/ mL; p=0.000). The optimal HBV DNA level for discriminating HBeAg-negative CHB cases from inactive HBsAg carriers was 2.0×10⁴ copies/mL. The serum HBV DNA levels were lower than the cutoff value in 72.3% (47/65) of the inactive HBsAg carriers, and in 31.5% (28/89) of the HBeAg-negative CHB patients. The serum HBV DNA levels differed significantly between these two groups. However, the levels in the two groups overlapped extensively, preventing the definition of a differentiation cut-off value.
Key Words : Hepatitis, Viral, Human; Hepatitis B, Chronic; HB e Antigens; Hepatitis B Surface Antigens; Virus, hepatitis
INTRODUCTION
Most hepatitis B virus (HBV) infections occur during delivery or infancy, and follow a chronic course among patients in Korea and other Asian countries (1, 2). The natural course of chronic hepatitis B (CHB) is determined by interactions between the host immune system and the virus. HBeAg seroconversion occurs during the immune clearance stage in 5-15% of patients every year. Once seroconversion is maintained and the serum HBV DNA level decreases markedly, the alanine transaminase (ALT) level normalizes, and the inflammatory reaction in the liver subsides (3). Whether spontaneous or due to therapy, HBeAg seroconversion is not only an important transition point throughout the natural course of chronic HBV infection but is also an essential factor in the clinical course of the disease. It is also a marker for evaluating therapies that involve interferon or lamivudine. In some patients, HBeAg-negative CHB is found after seroconversion, and HBV continues to proliferate, causing further liver damage and leading to an increased risk of liver cirrhosis and cancer (4,5). However, there are many cases of HBeAg-negative CHB that are difficult to differentiate from the inactive HbsAg carrier state due to frequent changes in the ALT levels (6).
In HBeAg-negative CHB with intermittent elevation of ALT, the amount of serum HBV DNA increases just prior to the rise in ALT. Ongoing HBV replication triggers immune responses, causing liver injury. Knowledge of the minimum amount of HBV needed to produce continuous liver damage is important for a better understanding of the natural course of the disease and of the cutoff value for clinical differentiation of HBeAg-negative CHB from the inactive HBsAg carrier state (7-12). Value of serum HBV DNA levels as determined by the hybridization method is limited, because assay sensitivity is as low as 105 to 106 copies/mL. In this study, we used a sensitive PCR-based assay to compare serum HBV DNA levels at different clinical stages of chronic HBV infection (13). The purpose of this study was to determine the serum HBV DNA level that would differentiate HBeAg-negative CHB patients from inactive HBsAg carriers.
Serum Hepatitis B Virus DNA Levels in Chronic HBV Infection
MATERIALS AND METHODS
Subjects
Of 434 consecutive chronic HBV-infected patients, 253 patients who did not have a history of notable alcohol intake (alcohol consumption of >40 g/wk) and who had not undergone anti-viral therapy during the previous six months were chosen. Any patients who were co-infected with HCV were excluded, as were 31 HBeAg-positive patients with normal ALT levels. In all, 222 chronic HBV-infected patients were studied retrospectively. This group consisted of 68 HbeAgpositive CHB patients (HBeAg-positive, ALT elevation), 89 HBeAg-negative CHB patients (HBeAg-negative, ALT elevation), and 65 inactive HBsAg carriers (HBeAg-negative, ALT normal). All of the patients’ALT levels had been tested more than twice during the previous six months.
Liver Function, Viral Marker Test and The Quantitation of HBV DNA
The Hitachi 7600 Series automatic biochemical analyzer (Hitachi, Tokyo, Japan) was used for the liver function test. The Abbott Axsym System (Abbott Laboratories, Abbott Park, IL, U.S.A.) was used to check for viral markers. Quantitation of HBV DNA was performed using the automated Cobas Amplicor HBV MonitorTM (Roche, Basel, Switzerland), which is as sensitive as 200 copies/mL (14, 15).
Purification of HBV DNA and Sample Preparation
Immediately after patient sampling, the blood sample was stored in a refrigerator, clotted for 1 hr, and the serum was centrifuged at 3,000 rpm for 5 min. The serum was then stored at -70°C. The HBV DNA was processed from 100 µL of serum by manual virion lysis and neutralization, and the DNA was precipitated with polyethylene glycol. The prescribed amounts of quantization standard (QS) particles were added to each sample and sample preparation, amplification reaction, and detection process, for use as markers in the quantitative study of the HBV DNA.
PCR Amplification and Quantification of HBV DNA
The processed sample (50 µL, equivalent to 22 µL of serum) was added to the 50- µL mixture in an amplification test tube (labeled A), and inserted into the Cobas analyzer. The 104-bp fragment, which represents the highly conserved preserved precore-core component, was amplified using one biotinylated template (HBV-104UB) and one non-biotinylated template (HBV-104D). The target HBV DNA QS was amplified using the same template that was used to generate the 104-bp amplicon.
After 30 cycles of amplification, denaturation solution was added automatically to tube A, in order to denature chemically the HBV and QS amplicons into single-stranded DNA molecules. The denatured amplicons were serially diluted in several detection glasses (labeled D) for quantitation across a broad dynamic range. Magnetic beads were added to each of the D glasses prior to hybridization with amplicon-labeled biotin, using specific oligonucleotides probe at the surface of the target HBV and QS sequence. After hybridization, the magnetic beads were washed by the Cobas analyzer. Avidinhorseradish peroxidase complex and TMB (3,3’,5,5’-tetramethyl benzidine) were added to form a pigment complex that had a light absorbance of 660 nm (A).
Within the linear range of the test (2×10²-2×10⁵ copies/mL), the light absorbance of each glass (A) correlated with the quantity of HBV DNA or QS amplicon. The Cobas analyzer multiplied the light absorbance level in glass D by the amplicon dilution factor to produce the total light absorbance. The
level of HBV DNA in each sample was calculated by the following equation (i.e., the ratio of the total light absorbance of the HBV DNA to the total QS light absorbance and the quantity of QS particles added):
HBV DNA/mL=Total HBV A660/Total QS A660×Added QS copies×45
where the total HBV A660 and total QS A660 values were calculated from the total light absorbances of HBV and QS, respectively; the added QS copies in the PCR mixture equalled the number of QS copies (kit-specific); and 45 was the number of copies per PCR, which was converted to the number
of copies per mL.
Statistics
Statistical analysis was carried out using the SPSS ver. 10.0 for Windows software (SPSS Inc., Chicago, IL, U.S.A.). The HBV DNA level of each group was expressed as the median value and range, while other clinical and laboratory values were expressed as means±the standard deviation. The differences between groups were analyzed using the chi-square test, ANOVA, and Mann-Whitney U test. An ROC curve was used to determine the cut-off concentration of HBV DNA that differentiated HBeAg-negative CHB cases from inactive HBsAg carriers.
RESULTS
Clinical Features of Patients
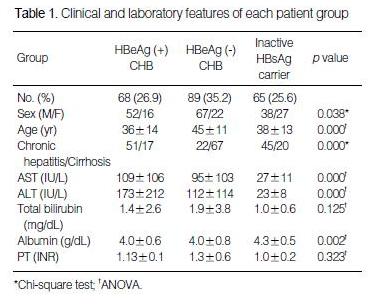
The mean age of the patients was 40±13 yr (mean±standard deviation), ranging from 7 to 69 yr. There were 157 male and 65 female patients. Liver cirrhosis was also present in 104 chronic hepatitis patients. The clinical and laboratory features of each group are shown in Table 1.
Serum HBV DNA Levels
Serum HBV DNA was detected in all (68/68) of the patients with HBeAg-positive CHB, in 94.4% (84/89) of the HbeAg negative CHB patients, and in 89.2% (58/65) of the inactive HBsAg carriers.
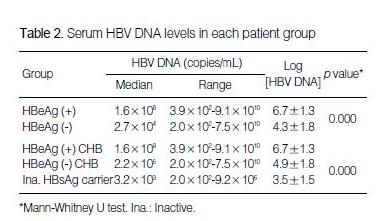
The median serum HBV DNA level of the HBeAg-positive CHB patients was significantly higher than that of the HBeAg-negative CHB patients (1.6×10⁸ copies/mL vs. 2.7 ×10⁴ copies/mL; p=0.000).
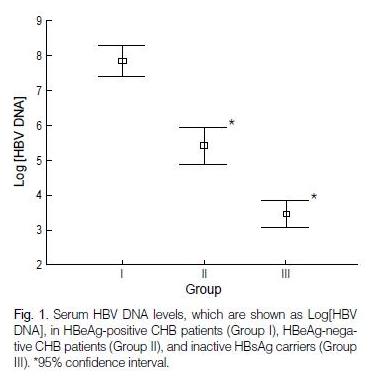
The median serum HBV DNA level of the inactive HbsAg carriers was 3.2×10³ copies/mL (range: 2.0×10²-9.2×10⁶), which was significantly lower than the median value for the HBeAg-negative CHB patients (2.2×10⁵ copies/mL; range: 2.0×10²-7.5×10¹⁰) (p=0.000; Fig. 1).
The cutoff value for the serum HBV DNA level that differentiated between HBeAg-negative CHB cases and inactive HBsAg carriers was set at 2.0×10⁴ copies/mL on the ROC curve, with 70.8% sensitivity and 72.3% specificity (Fig. 2).
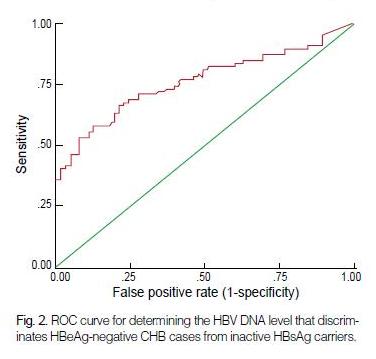
In this case, 27.7% (18/65) of the inactive HBsAg carriers were above the cut-off level, and 31.5% (28/89) of the HBeAg-negative CHB cases were below the level.
DISCUSSION
The aims of this study were to investigate serum HBV DNA levels at different clinical stages in patients with chronic hepatitis B virus infection, and to determine the serum HBV DNA level that would allow the discrimination of HBeAg-negative chronic hepatitis B patients from inactive HBsAg carriers in an endemic area. According to the results of this study, the median serum HBV DNA level for the HBeAg-negative patients was approximately two logs lower than that for the HBeAg-positive patients, regardless of ALT levels. The reason that the HBeAg-negative patients showed higher serum HBV DNA levels than in previous studies is related to differences in the target patient groups (16, 17). The previous studies included mainly inactive HBsAg carriers. In contrast, this study included not only inactive HBsAg carriers, but also HBeAg-negative CHB patients.
The features of the inactive HBsAg carrier state are known to include normal ALT, mild liver damage, and lower risk of progression to liver cirrhosis, despite a small risk increase for liver cancer (18). HBeAg-negative CHB has the characteristics of active HBV proliferation and progressive liver damage
after seroconversion (6). Over the natural course of chronic hepatitis B, the diagnostic criteria for the inactive HbsAg carrier state are as follows: HBsAg positivity, HBeAg negativity, normal ALT, and HBV DNA concentration of <105 copies/mL (3). However, the cut-off level for the HBV DNA is an arbitrary value, as proposed at the National Institute of Health Workshop, to differentiate HBeAg-negative CHB cases from inactive HBsAg carriers. In this study, serum HBV DNA was detected in 89.2% of the inactive HBsAg carriers, and the median level was 3.2×10³ copies/mL, which is significantly lower than the median value (2.2×10⁵ copies/mL) for HBeAg-negative CHB cases. Most of the serum HBV DNA levels for HBeAg-negative CHB cases were below the detection levels for HBV DNA quantitation by non-PCR based methods, which include hybrid capture, branched DNA signal amplification, and spot hybridization, which have lower limits of detection between 105 and 106 copies/mL (6).
The optimal cut-off value that allowed patient discrimination was 2.0×10⁴ copies/mL, although the accuracy associated with the adoption of this value was similar to that obtained with the known cut-off value of 105 copies/mL. With 2.0× 10⁴ copies/mL being set as the cut-off value, 27.7% (18/65) of
the inactive HBsAg carriers were above this level, and 31.5% (28/89) of the HBeAg-negative CHB patients were below this level. On the other hand, a cut-off value of 105 copies/mL resulted in 20.0% (13/65) of the inactive HBsAg carriers being above the cut-off level, and 40.4% (36/89) of the HBeAg-negative CHB patients being below. The result for the HbeAgnegative CHB patients was consistent with that of a recent study by Chu et al. (19), in which a cutoff value of 105 copies/ mL excluded 45% of HBeAg-negative CHB patients when testing was performed only at the time of presentation. Since
many HBeAg-negative CHB patients show highly variable patterns of disease activity, a wide distribution of HBV DNA levels around the arbitrary cut-off value is expected at this stage (20). These results show that it is difficult to define a single serum HBV DNA cut-off level that permits differentiation of HBeAg-negative CHB cases from inactive HBsAg carriers to use as a guideline in treating HBeAg-negative CHB patients. In contrast to our results, Chu et al. (19) showed that an HBV DNA value of >105 copies/mL excluded all of the inactive carriers, a finding that was supported by the work of Martinot-Peignoux et al. (21), who showed that the median serum HBV DNA level in inactive HBsAg carriers was 1,300 copies/mL, and that 98% of the HBV DNA samples were <105 copies/mL. The HBV DNA levels of the inactive HBsAg carriers in that study were similar to those observed in the present study. However, the median value was lower, and the range was narrower. This discrepancy may have resulted from differences in the follow-up periods, rather than differences in the selection of patients, since Chu et al. (19) also studied Asian patients.
HBV infection in Asians occurs mainly in early childhood. After more than 20 yr of immune tolerance, the immune clearance phase follows for a variable period of time. In many patients, HBV may continue to replicate after HBeAg seroconversion and cause liver damage. There have been many cases of severe liver damage, including cirrhosis with slow progression, even among inactive HBsAg carriers (22-24). The incidence of HBeAg-negative CHB is much higher in Asia than in Western countries (25-27). In many cases, the ALT level rises intermittently, and it is therefore difficult to differentiate the inactive carrier state from the HBeAg-negative CHB state over a short observation period (28). Thus, HBeAg-negative patients with normal ALT levels are not always inactive HBsAg carriers.
In conclusion, serum HBV DNA levels differ significantly between HBeAg-negative CHB patients and inactive HbsAg carriers. Serum HBV DNA levels may be an important factor in clinically differentiating HBeAg-negative CHB cases from inactive HBsAg carriers. However, the ranges of the
serum HBV levels overlap too widely to allow the definition of a discriminating cut-off value.
REFERENCES
- Stevens CE, Beasley RP, Tsui J, Lee WC. Vertical transmission of hepatitis B antigen in Taiwan. N Engl J Med 1975; 292: 771-4.
- Lok AS, Lai CL, Wu PC, Wong VC, Yeoh EK, Lin HJ. Hepatitis B virus infection in Chinese families in Hong Kong. Am J Epidemiol 1987; 126: 492-9.
- Lok AS, Heathcote EJ, Hoofnagle JH. Management of hepatitis B: 2000–Summary of a workshop. Gastroenterology 2001; 120: 1828-53.
- Hoofnagle JH, Shafritz DA, Popper H. Chronic type B hepatitis and the“ healthy”HBsAg carrier state. Hepatology 1987; 7: 758-63.
- Kaneko S, Miller RH, Di Bisceglie AM, Feinstone SM, Hoofnagle JH, Purcell RH. Detection of hepatitis B virus DNA in serum by polymerase chain reaction: application for clinical diagnosis. Gastroenterology 1990; 99: 799-804.
- Hadziyannis SJ, Vassilopoulos D. Hepatitis Be antigen-negative chronic hepatitis B. Hepatology 2001; 34: 617-24.
- Kuhns MC, McNamara AL, Perrillo RP, Cabal CM, Campbel CR. Quantitation of hepatitis B viral DNA by solution hybridization: comparison with DNA polymerase and hepatitis Be antigen during antivirall therapy. J Med Virol 1989; 27: 274-81.
- Zarski JP, Kuhns M, Berck L, Degos F, Schalm SW, Tiollais P, Brechot C. Comparison of a quantitative standardized HBV-DNA assay and a classical spot hybridization test in chronic active hepatitis B patients undergoing antiviral therapy. Res Virol 1989; 140: 283-91.
- Perrillo RP, Schiff ER, Davis GL, Bodenheimer HC Jr, Lindsay K, Payne J, Dienstag JL, O’Brien C, Tamburro C, Jacobson IM, Sampliner R, Feit D, Lefkowitch J, Kuhns M, Meschievitz C, Sanghvi B, Albrecht J, Gibas A, and the Hepatitis Interventional Therapy Group. A randomized, controlled trial of interferon alfa-2b alone and after prednisone withdrawal for the treatment of chronic hepatitis B. The Hepatitis Interventional Thezapy Group. N Engl J Med 1990; 323: 295-301.
- Zoulim F, Mimms L, Floreani M, Pichoud C, Chemin I, Kay A, Vitvitski L, Trepo C. New assays for quantitative determination of viral markers in management of chronic hepatitis B virus infection. J ClinMicrobiol 1992; 30: 1111-9.
- Berger A, Braner J, Doerr HW, Weber B. Quantification of viral load:clinical relevance for human immunodeficiency virus, hepatitis B virusand hepatitis C virus infection. Intervirology 1998; 41: 24-34.
- Lau GK, Leung YH, Fong DY, Au WY, Kwong YL, Lie A, Hou JL, Wen YM, Nanj A, Liang R. High hepatitis B virus (HBV) DNA viral load as the most important risk factor for HBV reactivation in patients positive for HBV surface antigen undergoing autologous hematopoietic cell transplantation. Blood 2002; 99: 2324-30.
- Pawlotsky JM, Bastie A, Hezode C, Lonjon I, Darthuy F, Remire J, Dhumeaux D. Routine detection and quantification of hepatitis B virus DNA in clinical laboratories: performance of three commercial assays. J Virol Methods 2000; 85: 11-21.
- DiDomenico N, Link H, Knobel R, Caratsch T, Weschler W, Loewy ZG, Rosenstraus M. COBAS AMPLICOR: fully automated RNA and DNA amplification and detection system for routine diagnostic PCR.Clin Chem 1996; 42: 1915-23.
- Noborg U, Gusdal A, Pisa EK, Hedrum A, Lindh M. Automated quantitative analysis of hepatitis B virus DNA by using the Cobas Amplicor HBV monitor test. J Clin Microbiol 1999; 37: 2793-7.
- Niitsuma H, Ishii M, Miura M, Kobayashi K, Toyota T. Low level hepatitis B viremia detected by polymerase chain reaction accompanies the absence of HBe antigenemia and hepatitis in hepatitis B virus carriers. Am J Gastroenterol 1997; 92: 119-23.
- Fujiwara K, Yokosuka O, Ehata T, Chuang WL, Imazeki F, Saisho H, Omata M. The two different states of hepatitis B virus DNA in asymptomatic carriers: HBe-antigen-positive versus anti-HBe-positive asymptomatic carriers. Dig Dis Sci 1998; 43: 368-76.
- de Jongh FE, Janssen HL, de Man RA, Hop WC, Schalm SW, van Blankenstein M. Survival and prognostic indicators in hepatitis B surface antigen-positive cirrhosis of the liver. Gastroenterology 1992; 103: 1630-5.
- Chu CJ, Hussain M, Lok AS. Quantitative serum HBV DNA levels during different stages of chronic hepatitis B infection. Hepatology 2002; 36: 1408-15.
- Pawlotsky JM. Molecular diagnosis of viral hepatitis. Gastroenterology 2002; 122: 1554-68.
- Martinot-Peignoux M, Boyer N, Colombat M, Akremi R, Pham BN, Ollivier S, Castelnau C, Valla D, Degott C, Marcellin P. Serum hepatitisB virus DNA levels and liver histology in inactive HBsAg carriers. J Hepatol 2002; 36: 543-6.
- Lok AS, Lai CL, Wu PC, Leung EK, Lam TS. Spontaneous hepatitis Be antigen to antibody seroconversion and reversion in Chinese patients with chronic hepatitis B virus infection. Gastroenterology1987; 92: 1839-43.
- Lee PI, Chang MH, Lee CY, Hsu HY, Chen JS, Chen PJ, Chen DS. Changes in serum hepatitis B virus DNA and aminotransferase levels during the course of chronic hepatitis B virus infection in children. Hepatology 1990; 12: 657-60.
- Lok AS, Lai CL. Acute exacerbations in Chinese patients with chroni chepatitis B virus (HBV) infection: Incidence, predisposing factorsand etiology. J Hepatol 1990; 10: 29-34.
- Laskus T, Rakela J, Nowicki MJ, Persing DH. Hepatitis B virus core promoter sequence analysis in fulminant and chronic hepatitis B. Gastroenterology1995; 109: 1618-23.
- Lindh M, Horal P, Dhillon AP, Furuta Y, Norkrans G. Hepatitis B virus carriers without precore mutations in hepatitis B e antigen-negative stage show more severe liver damage. Hepatology 1996; 24: 494-501.
- Chan HL, Leung NW, Hussain M, Wong ML, Lok AS. Hepatitis B e antigen-negative chronic hepatitis B in Hong Kong. Hepatology 2000;31: 763-8.
- Brunetto MR, Giarin MM, Oliveri F, Chiaberge E, Baldi M, Alfarano A, Serra A, Saracco G, Verme G, Will H, Bonino F. Wild-type and e antigen-minus hepatitis B viruses and course of chronic hepatitis. Proc Natl Acad Sci USA 1991; 88: 4186-90.
—— End